Enterprise Architecture Diagrams and Standards: Guide
Enterprise Architecture (EA) diagrams are far more than technical artifacts – they are essential business tools that help organizations visualize, plan, and execute business transformation. They provide a visual language for stakeholders to communicate and plan transformations across business, application, data, and technology layers. Also, because of their structured nature, they allow for automated analysis of the architecture. Yet, for many, EA diagrams can seem abstract or overly technical.
In this guide, we explore the importance, major types, standards, and best practices behind Enterprise Architecture diagrams. It weaves in the perspectives of the CFO, the business transformation lead, and the IT team – showing how Solution Design helps teams design, collaborate, and drive change effectively.
What are Enterprise Architecture diagrams and why do they matter?
Enterprise Architecture diagrams are visual representations that illustrate the structure, behavior, and interaction of an organization's systems and processes. These diagrams help bridge the gap between strategic intent and operational execution.
For the CFO, EA diagrams map investments directly to business functions and capabilities. Rather than sifting through jargon-filled spreadsheets or reports, a CFO can turn to an Enterprise Architecture diagram to see how planned IT expenditures support critical objectives, reveal redundancy, or highlight risks to the business. Visualizing the IT landscape in this way allows for smarter funding decisions, improved ROI, and better collaboration with IT and business leadership.
For the business transformation leaders, EA diagrams provide a common language that brings decision-makers together, cutting across department lines. When evaluating a strategic initiative – a merger, a shift to a new operating model, or the rollout of new products – these diagrams clarify how moving one part of the business affects the whole. They help stakeholders analyze the immediate impact of decisions, adjust plans on the fly, and unify efforts around shared goals.
For the IT team, up-to-date Enterprise Architecture diagrams offer immediate visibility into dependencies, technical debt, and bottlenecks, supporting proactive management rather than reactive firefighting. By keeping these diagrams aligned with the business context, IT ensures its work is not only technically robust but also strategically relevant.
In summary, EA diagrams help with:
- Communication: They provide a universal visual language, bridging the gap between business and IT stakeholders.
- Consistency: Adhering to diagram standards ensures clarity across teams and projects.
- Decision-making: Visual representations of complex systems enable quick impact assessment and scenario planning.
Core Enterprise Architecture diagram types
Enterprise Architecture diagrams come in several distinct types, each offering a unique lens. Focusing on the right diagrams for the right questions delivers more precise insight and better outcomes for all stakeholders.
1. Business architecture diagrams
Business architecture diagrams is a bucket term that captures the “what” and “who” – outlining high-level capabilities, value streams, organizational structures, and their relationships. For a CFO, this type of diagrams might highlight which business units own or rely on specific capabilities, providing context for funding or resource allocation. Business transformation leads use these diagrams to identify gaps or overlaps in processes, supporting informed interventions. IT benefits by understanding which capabilities require technology upgrades and by seeing how technical projects tie back to enterprise goals.
Key elements:
- Business capabilities and their hierarchy
- Value streams showing how value is delivered to customers
- Organization units and roles
- Business processes that realize capabilities
Each business architecture diagram can have one or a combination of the elements described.
Typical use cases:
- Strategic planning and capability modeling
- Business-IT alignment
- Identifying areas for process improvement or automation
2. Business context diagram
These diagrams map the business’s external interactions – customers, partners, regulators, suppliers – and how they connect to internal systems and functions. For transformation efforts, they clarify external drivers of change. CFOs can visualize risks across partner or regulatory boundaries. IT teams use these diagrams to assess how changes to systems may affect or be affected by stakeholders outside the organization.
Key elements:
- External stakeholders (e.g., customers, suppliers, regulators)
- Internal systems or business units
- Interactions and data exchanges
Typical use cases:
- Stakeholder mapping for new product rollouts
- Regulatory compliance assessments
- Business continuity planning
3. Application architecture diagram
Application architecture diagrams describe how software applications underpin business capabilities. They detail integrations, data exchanges, and ownership. CFOs gain visibility on which systems drive costs or redundancy. Business leads see which applications support strategic initiatives. IT relies on these diagrams to orchestrate migration, modernization, and integration projects.
Key elements:
- Applications and components
- Interfaces and integration points
- Application lifecycle or status
- Data flows and ownership
Typical use cases:
- Application rationalization and portfolio management
- System integration planning
- Understanding legacy vs. modern application coverage
4. IT/technology architecture diagram
Technology architecture diagrams decompose the infrastructure supporting applications, from servers and networks to cloud platforms and services. These diagrams help CFOs understand the value of infrastructure investments and inform risk management. Transformation leads use them for planning migrations and resilience. IT teams rely on them for managing technical debt, planning upgrades, and understanding their operating environment.
Key elements:
- Servers, storage, and network components
- Cloud platforms and services
- Hosting environments and infrastructure layers
- Technology stacks
Typical use cases:
- Infrastructure planning or cloud migration
- Risk and resilience assessments
- Technology standardization and lifecycle tracking
Want to turn constant change into a scalable, repeatable advantage? Download this eBook.
Changing How We Change: Building the Architecture of Transformation That Lasts
5. Data architecture diagram
These diagrams focus on how data is captured, stored, processed, and transferred across systems. They reveal sources and consumers of data, identify silos, and support compliance. For CFOs, they can surface data quality or privacy risks. Business leads use them to understand reporting and analytics capabilities. IT teams rely on these diagrams to trace data lineage and ensure data flows are robust and secure.
Key elements:
- Data entities and domains
- Data stores (e.g., databases, data lakes, warehouses)
- Data flows and transformations
- Source systems and consumers
Typical use cases:
- Data governance and compliance (e.g., GDPR, HIPAA)
- Designing data pipelines and integrations
- Supporting analytics, reporting, and AI initiatives
- Identifying data duplication or silos
Standards and notations
To produce meaningful, consistent, and reusable diagrams, organizations rely on modeling standards:
|
Standard/Language |
Purpose |
Use case |
|
Models enterprise layers (business, app, technology) |
Organization-wide EA visualization |
|
|
Process diagrams |
Business process mapping |
|
|
UML Sequence Diagrams |
Unified Modeling Language for software architecture |
App development, software design |
|
Hierarchical architecture views in software design (context → code) |
All abstraction levels, from business to code |
Architecture diagram signs and symbols
Architecture diagrams make use of an extensive library of visual signs and symbols, tailored to the context:
- Basic elements: Free shapes used for expressing an idea, communication, and mutual understanding of a concept (boxes for systems/components, lines/arrows for relationships/data flow, icons for specific entities (database, server, user)).
- ArchiMate symbols: Include notations for layers, relationships, motivation, and physical elements.
- Domain-specific symbols: Cloud provider icons (AWS, Azure, GCP), architectural patterns (gateways, firewalls), and process-specific free shapes.
For standardized representation, always reference the latest specification for your chosen modeling language.
Enterprise Architecture diagram use cases
- Solution Design: Visualize and assess solution options before committing to change.
- Roadmapping: Align transformation efforts to timelines and impact.
- Compliance and risk: Audit technical debt and align architecture to policy frameworks.
- Innovation enablement: Quickly identify reusable capabilities for new products.
- Automated analysis: Use dashboards, reports, consistency checks, and AI/ML-powered suggestions for faster, smarter decisions.
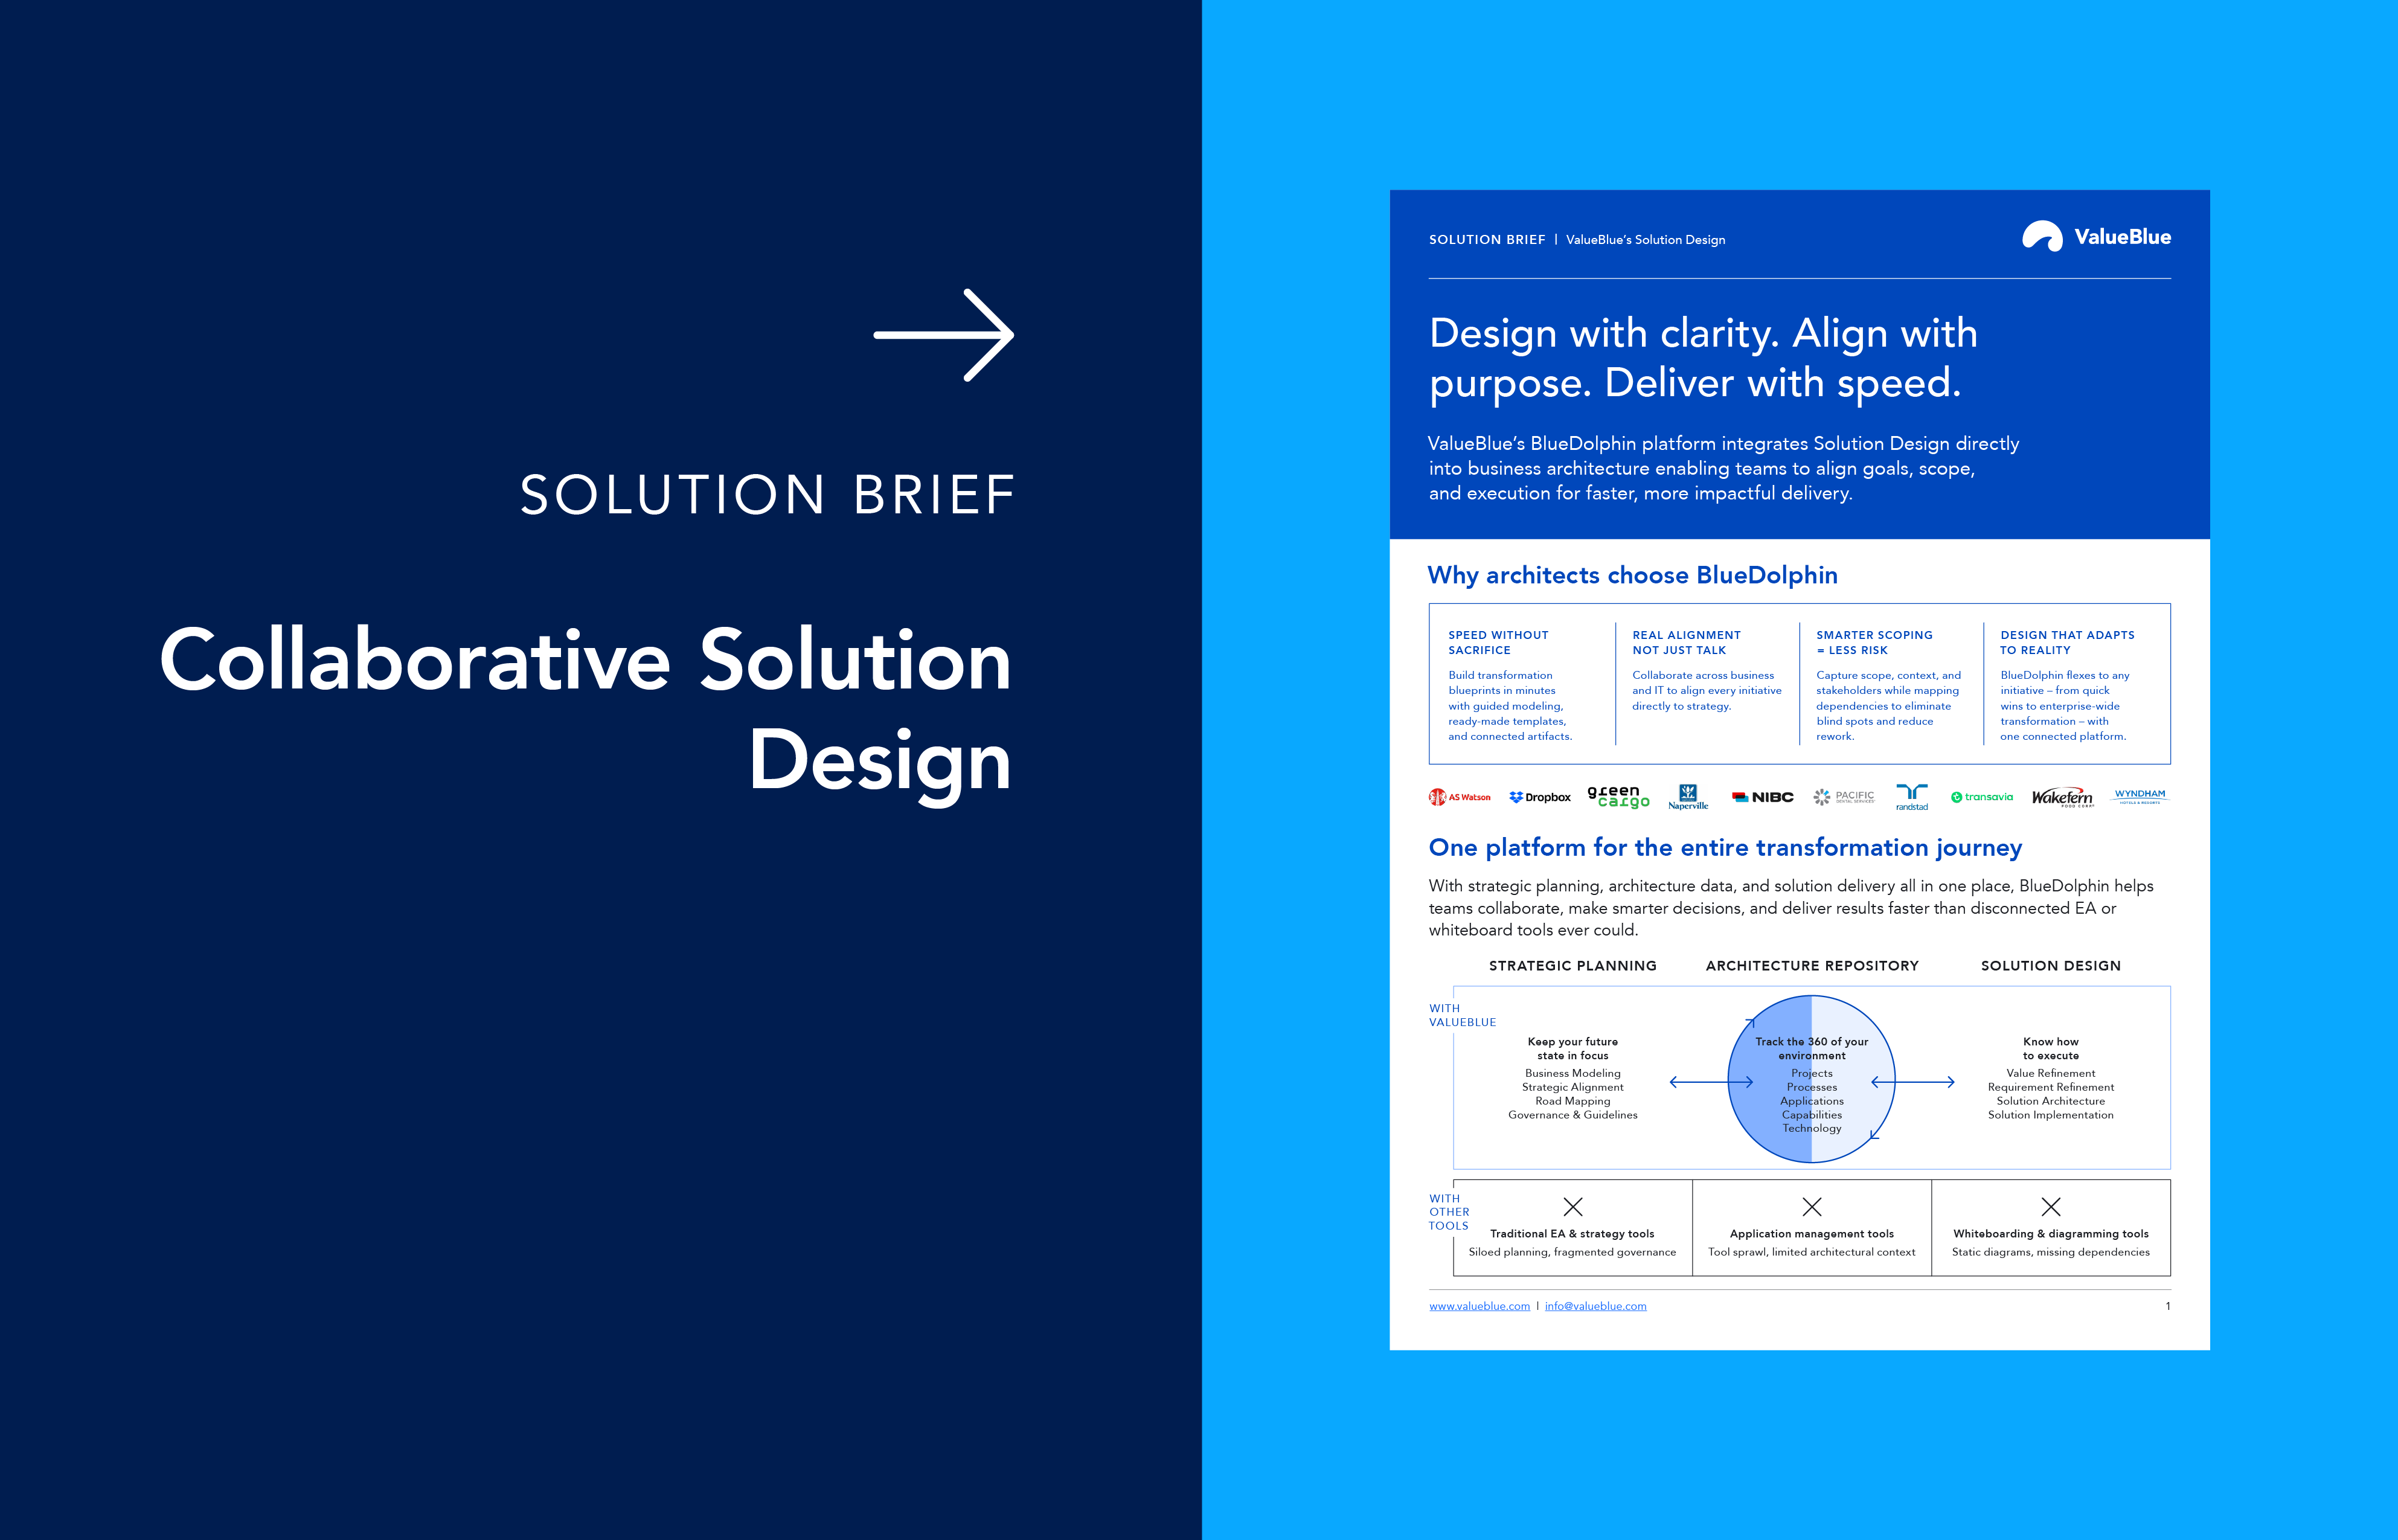
ValueBlue’s approach to Solution Design in Enterprise Architecture
- Accelerate architecture design: With a library of architecture templates, reference models, and intuitive diagramming for rapid scenario building.
- Support multiple modeling languages: Seamless integration of ArchiMate and BPMN to serve various stakeholders and use cases.
- Centralize and democratize architecture: Store all architecture objects, diagrams, and relationships in a single intelligent repository.
- Enhance collaboration: Role-based access and cross-departmental collaboration tools ensure input from every relevant team, boosting adoption and architectural quality.
- Drive agile transformation: Design, manage, and optimize solutions iteratively with continuous analysis and impact assessment for transformation projects.
- C4 model practices: Layered abstraction for diagrams, from high-level context down to detailed code structures, making complex systems digestible at every stakeholder level.
Best practices for Enterprise Architecture diagrams
- Anchor every diagram in business goals: The value of any diagram is determined by how well it supports strategic objectives.
- Use standard notations and keep layers distinct: This ensures clarity and enables smooth collaboration between business and technical audiences.
- Tell a compelling story: Guide each reader from the current state, through options and risks, to an actionable future vision.
- Enable broad stakeholder collaboration: Great diagrams invite participation, capturing perspectives from finance, business, and IT.
- Refresh diagrams regularly: Outdated diagrams lose trust. Continuous updates preserve value and relevance.
- Leverage automation: Use tools that surface inconsistencies, highlight opportunities, and support rapid scenario evaluation.
Turning diagrams into drivers of transformation
Effective Enterprise Architecture diagrams are the connective tissue of any digital business. For CFOs, they provide clarity on investment impact, risk, and opportunity. Business transformation leaders use them to guide cross-functional change and keep everyone aligned. IT uses them to navigate complexity, act on real-time data, and deliver agile solutions.
With advanced platforms such as BlueDolphin, diagrams evolve from static pictures into living models, supporting data-driven innovation and truly democratizing architecture for all. Whether launching new offerings, modernizing the application landscape, or building resilience, the right Enterprise Architecture diagrams – used collaboratively – make strategic goals achievable, aligning every part of the organization for success.
Book a demo
Explore how you can design and align your transformation initiatives more effectively - from strategy to execution.
Have questions about Enterprise Architecture best practices?
Our experts are happy to help.


