In Enterprise Architecture (EA), all applications, actors, business processes, data, solutions, technology, and more are represented as so-called objects. Combining obje
cts and presenting them in a single view helps you to create overviews and insights into what it is you want to investigate.
Do you want to map all the projects that realize your sustainability goals? Or see what applications the HR department uses? You can create these insights in EA views to take data-driven decisions and share the insights with relevant stakeholders. Yet, how do you retrieve data scattered throughout the organization and exactly how deep can the object data rabbit hole go?
Object Data Gathering Made Easy
Enterprise Architects simply cannot – nor should they – spend most of their time scouring the organization for the necessary object information to construct their architectural views. Ideally, this should be (almost) automated way. And as Enterprise Architects are the keepers of the object information, they should be able to retrieve or request these bits of information without losing control over the object’s data validity and quality.
Within our digital transformation platform BlueDolphin, we present the collaboration aspect of enterprise architecture as the solution to that challenge. For example, an application object is missing the end-of-life date. Enterprise Architects can simply email a questionnaire to the owner of the application, asking them to provide that specific bit of information, and it’s automatically incorporated into the application object’s data. No matter whether the owner has an account in BlueDolphin or not. This collaboration is what makes object data gathering easy, leaving time for the tasks that matter more.
Rationalizing Object Relationships
When thinking about the attributes of objects-applications, processes, capabilities, process tasks, or data objects – they all have properties linked to them. For instance, by adding the supplier and hosting location to an application, or a RACI matrix to a process they become linked.
However, what if one object can influence a second object? For instance, when applications integrate, or when a business actor is responsible for a business capability. In such a case, there is a direct relationship between objects. Object relationships occur all the time, as our IT infrastructure grows and becomes more accessible to the entire business.
The challenge with such relationships is that it is often unclear how the two objects interact with each other. Which way does the relationship go? Is a specific object part of your current state or only your future state architecture?
Instead of diving into the object properties on both ends of the relationship, we have enabled Enterprise Architects with better ways of gathering and managing that information. Throughout three separate BlueDolphin product releases, we have expanded the platform’s questionnaire functionalities to include specific object relationship fields – starting with the product release called Baiji.3. With relationship questionnaires, you can request information on the relationship between objects from the people who know – and have them update that information directly into the objects’ relationship.
Then, with our second product update, Commerson.2, information stored in relationship questionnaires became available in OData, thus allowing for specific filtering and comparing of the relationships for reporting purposes.
From Information to Insights
However, collecting information on relationships isn’t a goal in itself — it’s about the insights they deliver to help you make data-driven decisions. That’s why our third product release, Commerson.2, added the functionality to visualize object relationships in heatmaps, also known as conditional layouts.
Conditional layouts have been present in BlueDolphin for quite some time now. With all the underlying data related to objects, you can instantly see which applications are needed for a specific business capability. Additionally, you can see which projects are best supporting the organization toward the defined future state. This viability is made possible by simply selecting the (mix of) conditions you want to visualize in a view.
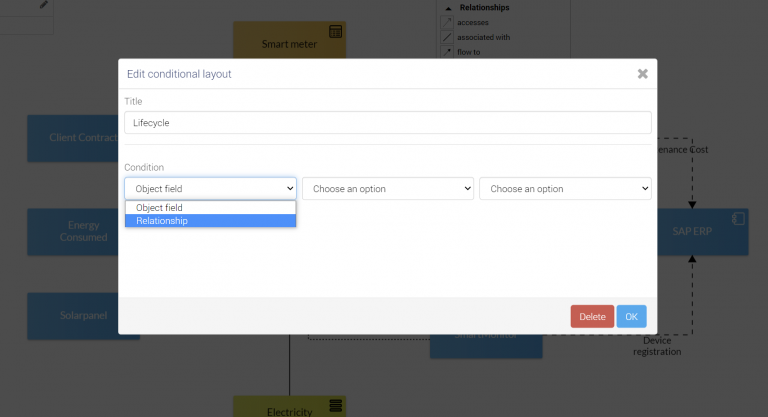
Previously, when you would edit the parameters for a conditional layout, it showed you the conditions from object fields. With Commerson.2, you now have the option to base the visualization on the info from relationships as well.
What Will it Look Like in Your Views?
It is important to note that instead of highlighting the relationships in a view, represented as the ‘lines’ between objects, the conditional layouts for relationships will still highlight objects. We have chosen this approach because simply not all views have relationships visually represented, such as with business capability mappings, or with project design templates. No matter the design of your view, relationship data can still be presented in this way.
The relationship conditional layout helps you answer questions such as “Show me the applications related to process X and have a business value of 1”. Such a query instantly highlights the application objects that are part of a process but bring only little value. These kinds of insights will help you with Application Portfolio Rationalization, for instance.
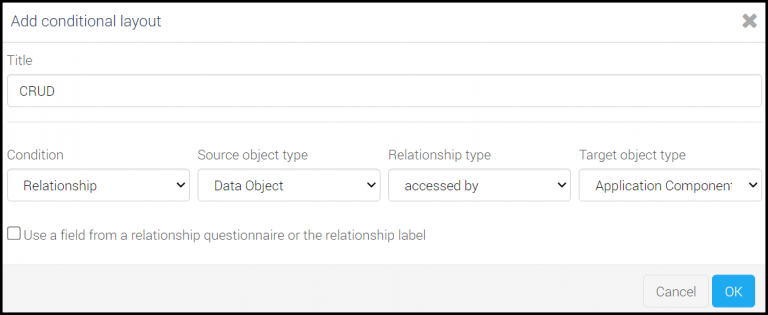
In the example below, you can choose to see which data objects are accessed by a specific application component for the purpose of a CRUD analysis (Create, Read, Update, Delete).
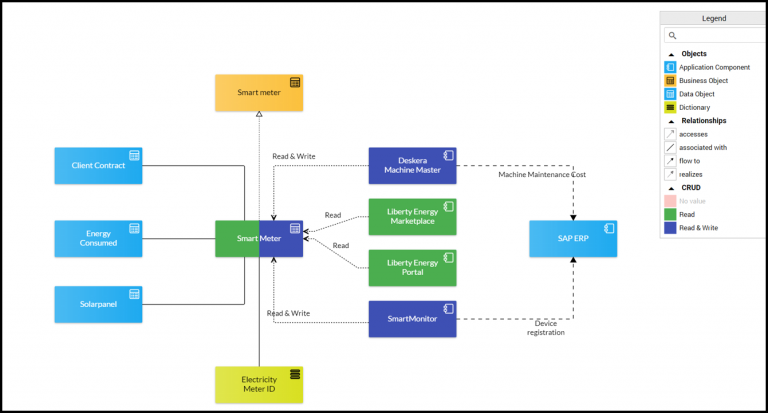
Resulting in the following view, in which Read and Read & Write are the conditions highlighted in green and dark blue.
What Heatmaps Will You Create?
There are tons of other use cases possible with the relationship conditional layout feature. It allows you to answer questions such as “Which architecture principles show certain deviations from the ‘Approved’ state?” and “What are the lifecycle stages of application components in a certain data object?”
Do you have more questions about the possibilities of conditional layouts for object relationships? Watch the full product release webinar on demand here!
