

Organizations invest heavily in projects, yet too few deliver the results leaders expect. According to recent research from the Project Management Institute, less than half of projects are considered a success. PMI’s 2024 Pulse of the Profession shows that while organizations are investing heavily in digital transformation, many initiatives still stall or fall short.
That gap doesn’t always come from poor execution. More often, it’s rooted in unclear objectives, hidden dependencies, or unresolved problems. This is where impact analysis and root cause analysis provide structure: helping teams clarify scope, trace downstream effects, and diagnose the true causes behind issues before they escalate.
In this guide, you will learn what impact analysis means in an Enterprise Architecture context, how to use a fishbone diagram for root cause analysis, who typically performs these analyses, and a repeatable way to run them across strategic and operational work.
Table of contents
What is impact analysis?
Why impact analysis matters at a project start
Root cause analysis with the fishbone diagram
How to use a fishbone diagram for root cause analysis
Strategic vs operational impact: when to use which lens
Who performs impact analysis in project management
Step-by-step guide to impact analysis and root cause (with fit analysis)
Example scenario: Tracing operational impact in order-to-cash
Key takeaways
What is impact analysis?
Impact analysis is a structured way to trace the cause-and-effect ripple of a proposed change across your organization’s people, processes, applications, data, and infrastructure. In Enterprise Architecture (EA), it answers questions such as:
- If we patch or replace software on a specific server, which applications, processes, and departments are affected?
- If we redesign a business process, what downstream systems, integrations, and data contracts change?
- If we pursue a strategic goal (e.g., improving customer experience), which capabilities and initiatives must move, and what gets disrupted?
In day-to-day terms, impact analysis connects the “little tin server in a dark room” to the HR process it silently enables – and to the risks if it fails. The value is visibility: you can pull the thread from any starting point (business or technology) and see dependencies before you approve scope, commit budget, or schedule a release.
Why impact analysis matters at a project start
In Enterprise Architecture, we use a project start architecture to establish scope and feasibility before execution. Impact analysis at this point avoids surprises, such as “This upgrade takes 50% of our applications offline”, and informs a go/no-go decision, sequencing, and risk plan.
It is the discipline of revealing upstream and downstream effects, so you can decide whether to change, how to change, and in what order to change.
Root cause analysis with the fishbone diagram
When something is under-performing or breaking, you pair impact analysis (what’s affected) with root cause analysis (why it’s happening). Impact analysis shows the scope of the disruption, while root cause analysis investigates the underlying factors that triggered it. Together, they ensure you’re not only aware of the ripple effects but also equipped to address the source of the problem. The most approachable tool for structuring this kind of investigation is the fishbone diagram (Ishikawa).
How to use a fishbone diagram for root cause analysis
1. Define the problem clearly.
Example: “Order processing SLA breaches increased 20% last quarter.”
2. Draw the spine and main bones (cause categories).
Typical categories: Process, People, Technology/Applications, Data, Infrastructure, Policy/Governance, External/Regulatory.
3. Brainstorm potential causes under each bone.
Keep fact-finding separate from fault-finding.
4. Collect evidence.
Pull process metrics, incident tickets, architecture views, dependency maps, and data quality checks.
5. Prioritize likely root causes.
Score by frequency, impact, and ease of validation.
6. Validate and confirm.
Run a small test, replay logs, or measure a targeted process step.
7. Propose corrective actions.
Tie each action to an impact check so the fix does not create new downstream risk.
Fishbone analysis root cause and impact analyses are complementary: the fishbone narrows why, and impact analysis reveals what else moves when you fix it.
A fishbone diagram used for root cause analysis helps teams narrow down why a problem occurs by grouping potential causes into categories.
Strategic vs operational impact: When to use which lens
Impact analysis can be applied from two complementary perspectives, depending on whether you begin with business goals or with technical triggers.
- Strategic lens: “How do we improve customer experience?” Start from business outcomes and capabilities; trace impact to processes, applications, and data. This approach highlights which initiatives must be launched and in what sequence to achieve the desired outcome.
- Operational lens: “A vulnerability is flagged on CRM.” Start from technology (e.g., a server or application) and trace up to the processes, departments, data, and compliance exposure.
Both paths converge in EA views that make dependencies explicit for informed decisions, whether you begin at the business layer or the IT layer.
Who performs impact analysis in project management?
Impact analysis in project management is typically performed as a joint effort rather than by a single role. In most organizations, project managers rely on contributions from the following stakeholders:
- Business analysts – first line of discovery on processes, people, requirements;
- Enterprise architects – maintain the dependency picture and future-state blueprint;
- Innovation leads/product owners – drive the “why now” and benefit hypothesis.
Vendors like ValueBlue enable the team with a structured approach and collaborative platform rather than doing the consulting for you. Your team runs the analysis; BlueDolphin makes it fast, repeatable, and visible across stakeholders.
Step-by-step guide to impact analysis and root cause (with fit analysis)
Use this repeatable flow for both impact and root cause work:
1. Frame the change or problem.
-
- Change: “Replace legacy CRM by Q2.”
- Problem: “Payment failures spiking post-patch.”
2. Run high-level impact analysis.
- From the starting point (process, system, or goal), traverse upstream and downstream.
- Identify affected departments, roles, SLAs, integrations, data lineage, and policy controls.
3. Assess fit analysis options.
- Evaluate candidate solutions or process changes for functional fit, integration fit, and operating-model fit.
- Score business value, risk, complexity, and time-to-benefit to support prioritization.
4. Deep-dive root cause (if needed) with a fishbone.
- Build the diagram, gather evidence, validate the top hypotheses, and propose remediations.
5. Decide go/no-go and sequencing.
- Use the impact map to craft a safe rollout plan, change windows, and communication to affected teams.
6. Model the future state.
- Just like you wouldn’t “knock down walls” without drawings, document the target architecture – processes, applications, data – and show how it improves operational impact (risk, uptime, cost).
7. Collaborate and govern.
- Keep stakeholders (business and technical) in one shared source of truth. Track decisions, owners, and due dates.
8. Measure outcomes and learn.
- Tie actions to KPIs. Feed lessons back into your roadmap so improvements compound over time.
Example scenario: Tracing operational impact in order-to-cash
Situation: A security scan flags a critical vulnerability on a middleware server. What looks like a small technical issue quickly grows once you begin tracing the connections.
Operational impact questions:
• Which applications use that middleware? (OMS, CRM, Billing)
• Which business processes rely on those apps? (Order capture, fulfillment, invoicing)
• Which departments are exposed? (Sales Ops, Finance, Customer Service)
• What data is at risk? (Customer PII, payment tokens)
• What is the service impact if the server is patched during business hours? (SLA breaches, revenue delay)
These are the kinds of questions impact analysis surfaces early – showing how a single server issue cascades across applications, processes, departments, and data.
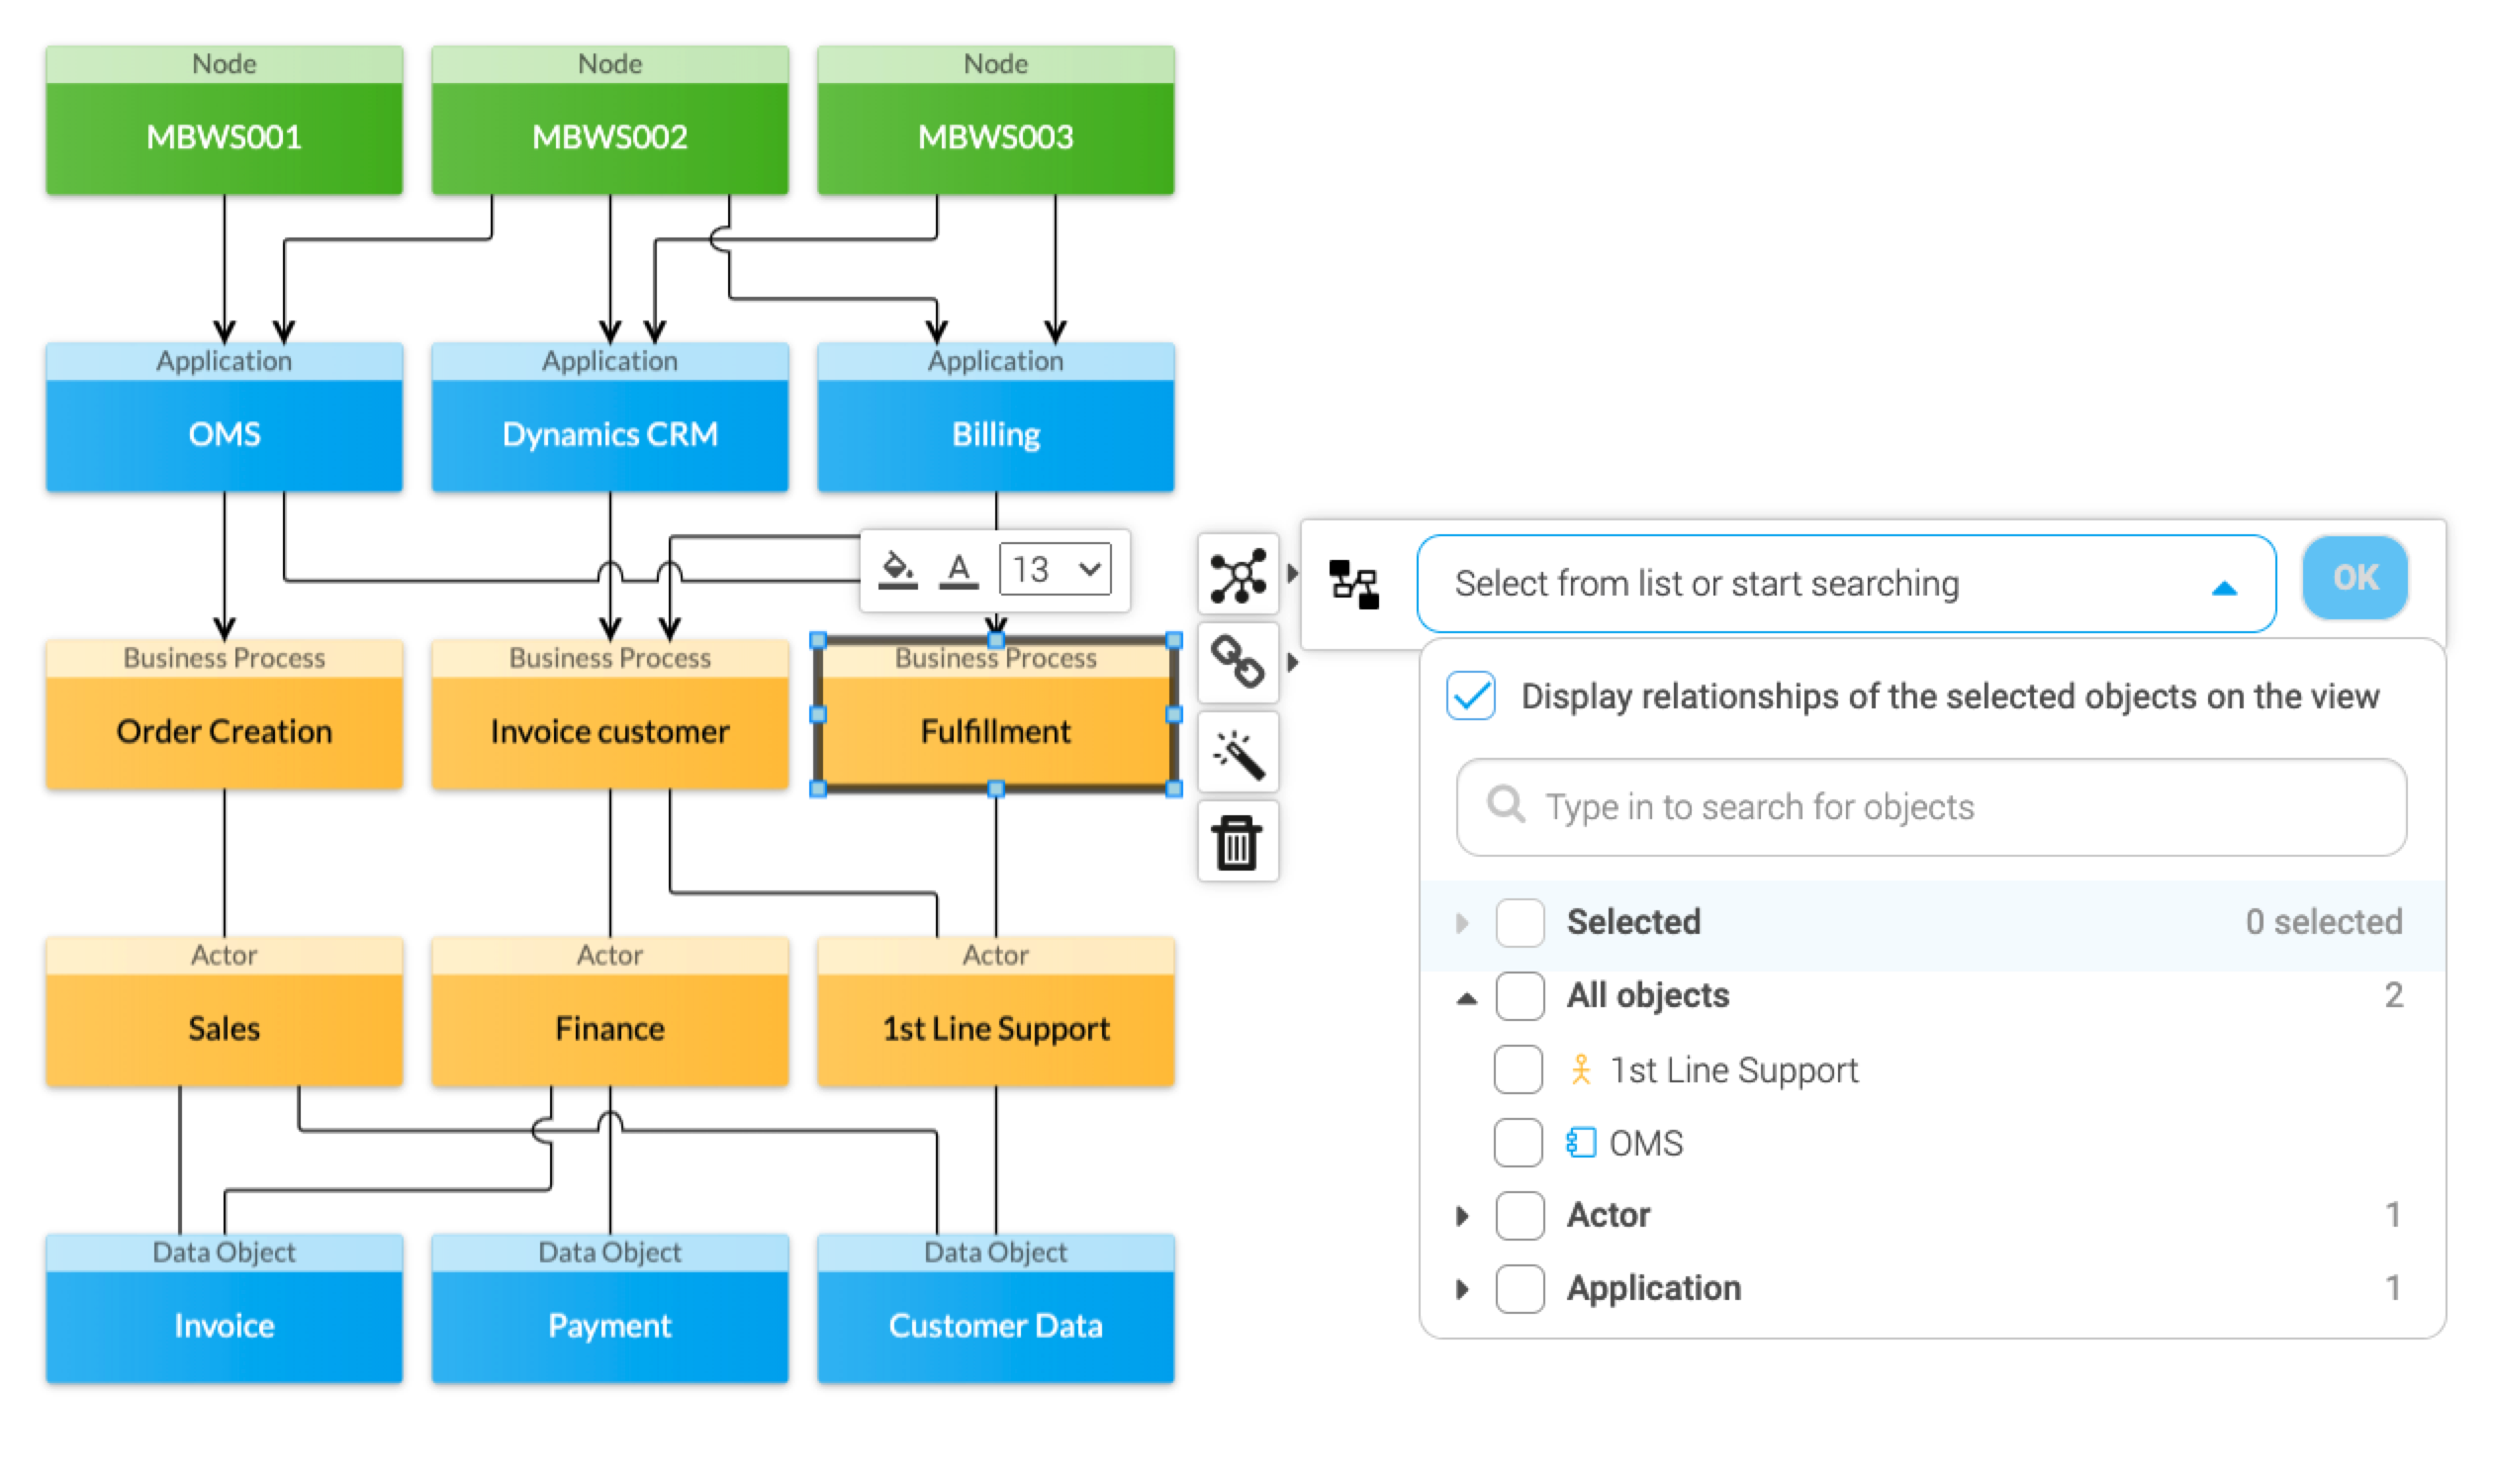
Example of how BlueDolphin shows the impact middleware changes/vulnerability can make on various processes in the organization.
Root cause fishbone highlights:
• Process: Unclear change window approvals
• People: Noone on-call during patch window
• Technology: Single point-of-failure middleware; no blue-green path
• Data: Stale data contracts; downstream schema mismatch
• Policy: Patch policy exists, but enforcement gaps
The fishbone view makes it easier to see not just what broke, but why it broke across multiple dimensions.
Actions:
• Short term – schedule an emergency patch with business sign-off; set a freeze on dependent deployments; communicate to affected roles.
• Medium term – add redundancy and blue-green deployment for middleware; formalize change windows.
• Long term – modernize integration pattern, update data contracts, and reflect the new target state in the roadmap.
By running the same pattern on strategic changes (for example, “improve customer experience”), you can start at the capability layer, discover dependent processes and systems, test hypotheses with a fishbone to see where delays are introduced, and design improvements with a clear understanding of operational impact.
Key takeaways
- Impact analysis shows what else moves when you change something; fishbone root cause reveals why it broke or under-performed.
- Use impact analysis at project start to set scope, reduce risk, and align stakeholders before committing to delivery.
- Start from either direction – business goal or technical trigger – as long as you connect all dependencies.
- Make fit analysis explicit so selected options align with process, integration, and operating-model realities.
- Treat your analysis outputs as living architecture: update them as you learn and feed them into your roadmap.
From analysis to outcomes: Try Solution Design
Ready to make change safer and faster? See how BlueDolphin Solution Design helps teams run consistent impact and root cause analysis, prioritize the right work, and collaborate in one place. Book a demo today.
FAQ
1. What is impact analysis?
Impact analysis is the practice of tracing how a proposed or unplanned change affects processes, applications, data, infrastructure, departments, and compliance, so you can size scope, risk, and sequencing before you act.
2. What is root cause analysis and when should I use a fishbone diagram?
Root cause analysis identifies the underlying causes of a problem, so fixes are effective, not cosmetic. A fishbone diagram structures the exploration of causes across categories (Process, People, Technology, Data, Infrastructure, Policy, External) and helps teams converge on evidence-based actions.
3. Who performs impact analysis in project management?
Typically, business analysts lead discovery with enterprise architects facilitating dependency views, while project managers steward scope and risk. Innovation leaders or product owners often participate when the change is tied to new value creation.
4. How do impact and root cause analysis relate to operational impact?
Operational impact is the real-world effect on SLAs, customer experience, cost, and risk. Use impact analysis to enumerate those effects, and root cause analysis to ensure your corrective or design changes reduce the impact rather than shifting it elsewhere.
5. What is fit analysis?
Fit analysis evaluates whether a proposed solution or change fits your processes, integration landscape, data model, and operating model. Scoring by business value, risk, complexity, and time-to-benefit helps you prioritize the best option.
6. How does this tie into roadmapping?
Your findings should feed your technology roadmap – adjusting priorities, sequencing, and dependencies. Treat both analyses as living inputs to strategic planning. For an example of structure and tone, see our roadmap guide.